How to Debug iPhone Safari with Windows Chrome
This article explains how to debug a page opened in iOS (iPhone) Safari on from Chrome on Windows PC.
Purpose of this article
In website development, debugging of smartphones is often done using PC browser emulators, but there may be a bug that occurs only on the actual device.
In this case, the cause cannot be identified with the emulator alone, so the behavior must be checked with the actual device. At this time, it will be more efficient if you can use the developer tools to inspect the page you are viewing on your phone as you would on a PC browser.
In the case of Android devices, debugging can be done with Chrome on the PC. In this case, the following official Google article is helpful.
In this article, I will summarize the procedure for debugging Safari on your iOS (iPhone) with Chrome Developer Tools for PC when you are working on Windows.
First, install Scoop, a package management software for Windows.
What is Scoop?
Scoop is a command-based package manager for Windows.
Once Scoop is installed, you can install and uninstall software using commands in PowerShell (*) (or Command Prompt).
*PowerShell is the successor to the Windows command prompt. The following article explains it in detail.
Reference (Japanese): PowerShell(パワーシェル)は何ができるの?メリット、使い方、実例まで|ドスパラ通販【公式】
Scoop Official Website : Scoop
How to install Scoop
Use the following command to install Scoop.
Invoke-Expression (New-Object System.Net.WebClient).DownloadString('https://get.scoop.sh')
This is also the same for the following command.
iwr -useb get.scoop.sh | iex
If you get an error due to permissions, the official site says to change the permissions.
Note: if you get an error you might need to change the execution policy (i.e. enable Powershell).
If you want to change the execution permissions of Powershell, etc., execute the following command.
Set-ExecutionPolicy RemoteSigned -scope CurrentUser
However, this will change the permissions for the current user, so if you want to apply it only to the current user and the current process, execute the following command.
Set-ExecutionPolicy RemoteSigned -scope Process
You can check if the permissions have been changed by using the following command.
Get-ExecutionPolicy
After executing the above, you will see RemoteSigned, which has the following types of permissions.
Restricted: All NG, which seems to be the default.
AllSigned : OK if signed.
RemoteSigned: Local files are OK, online files are OK if they are signed.
Unrestricted: All are OK, but the ones on the net need to be checked before execution.
.
However, in this case, when you exit Powershell, the permissions will return to Restricted, so if you want to change the permissions again, you will need to run "Set-ExecutionPolicy RemoteSigned -scope Process" again.
Check if Scoop has been installed.
Run the following help command, and if the help is displayed, the installation is complete.
scoop help
Install iOS WebKit Debug Proxy and RemoteDebug iOS WebKit Adapter.
Overview
The next step is to install the following three apps (libraries).
- iOS WebKit Debug Proxy : Tool for manipulating Safari on real iOS
- RemoteDebug iOS WebKit Adapter : A tool needed to debug iOS with Chrome based debugging tools
- libimobiledevice : a library to communicate with iOS services
This time, we will proceed as described in the README.txt of RemoteDebug iOS WebKit Adapter below.
ios-webkit-debug-proxy with libimobiledevice installation
First, use the following Scoop command to extend the apps that can be installed by Scoop.
scoop bucket add extras
The ```bucket`` looks like a JSON file that contains the Git repository for each app and the installation instructions for the app.
Scoop has an app (bucket) called main bucket by default, but apps that do not meet the criteria of main bucket even if they are still considered useful are stored in a bucket called extra.
This extra includes ios-webkit-debug-proxy, so we need to executed the code above first.
Now, after installing the extra bucket with scoop bucket add extras, install ios-webkit-debug-proxy with the following command.
scoop install ios-webkit-debug-proxy
Install remotedebug-ios-webkit-adapter
This can be installed using NPM. The command is as follows.
npm install remotedebug-ios-webkit-adapter -g
Enable Safari's Web Inspector on iOS (iPhone).
Follow the steps below to enable it.
- Go to iOS (iPhone) Settings and open Safari Settings.
- Tap Advanced
- Tap the switch in the Web inspector to enable it
Connect iPhone to PC and trust the device
Connect your iPhone to your PC with a cable.
A pop-up will appear on your iPhone asking like "Do you trust this computer? " and click "Yes".
On the PC, launch iTunes and you will see the similar message, so click "Yes".
Run remotedebug_ios_webkit_adapter
Run it with the following command.
remotedebug_ios_webkit_adapter --port=9000
Note that when you run the above command, ios-webkit-debug-proxy will also be executed automatically, so you don't need to do anything special here.
Configure Chrome's Developer Tools settings to allow you to see pages opened in Safari on iOS
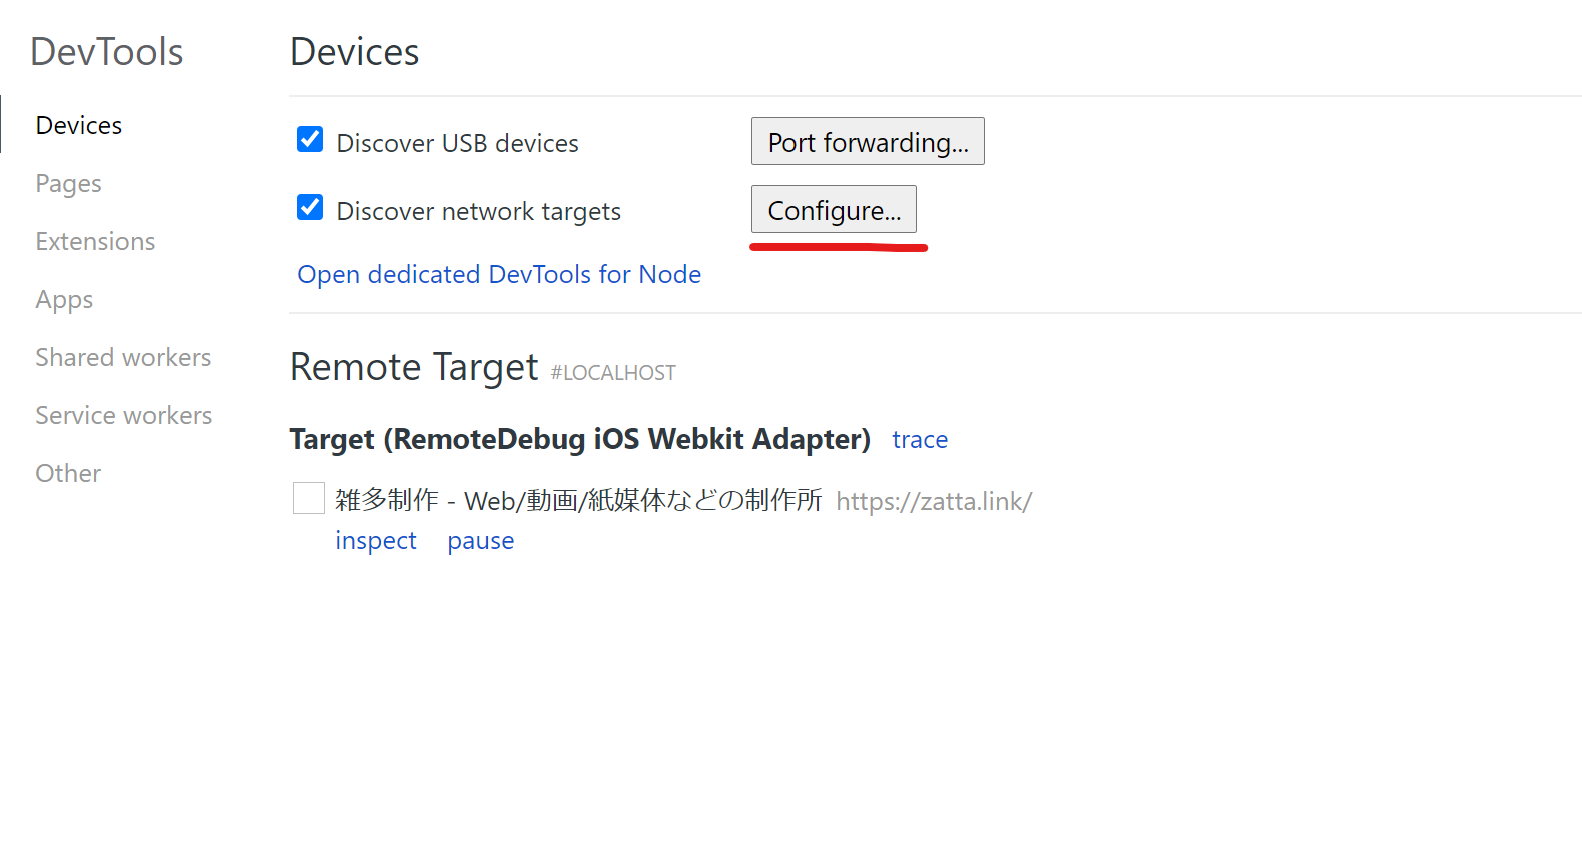
First, go to the Developer Tools settings page of Chrome on your PC (chrome://inspect/) and click Configure in the Discover network targets section.
Please refer to the following image.
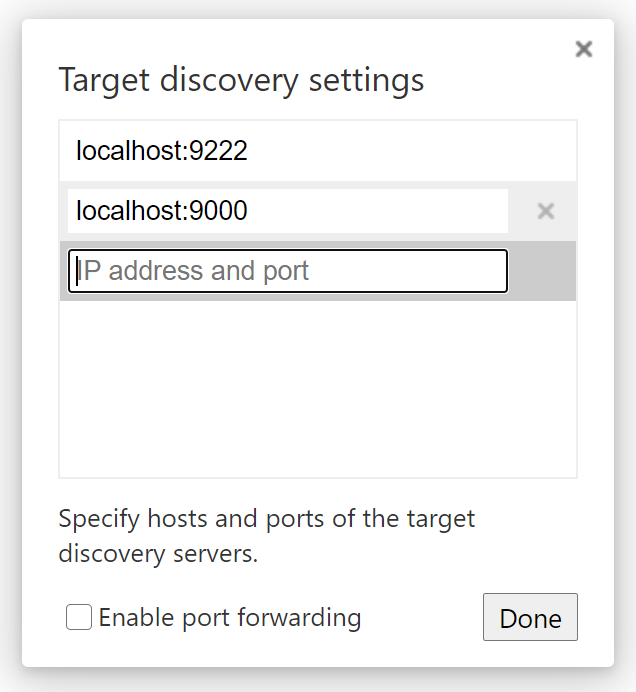
Next, type localhost:9000 in the popup that appears and click Done.
Now the setup is set.
Debug the page you are viewing in iPhone Safari with your PC's Chrome Developer Tools.
First, navigate to some website in Safari on your iPhone.
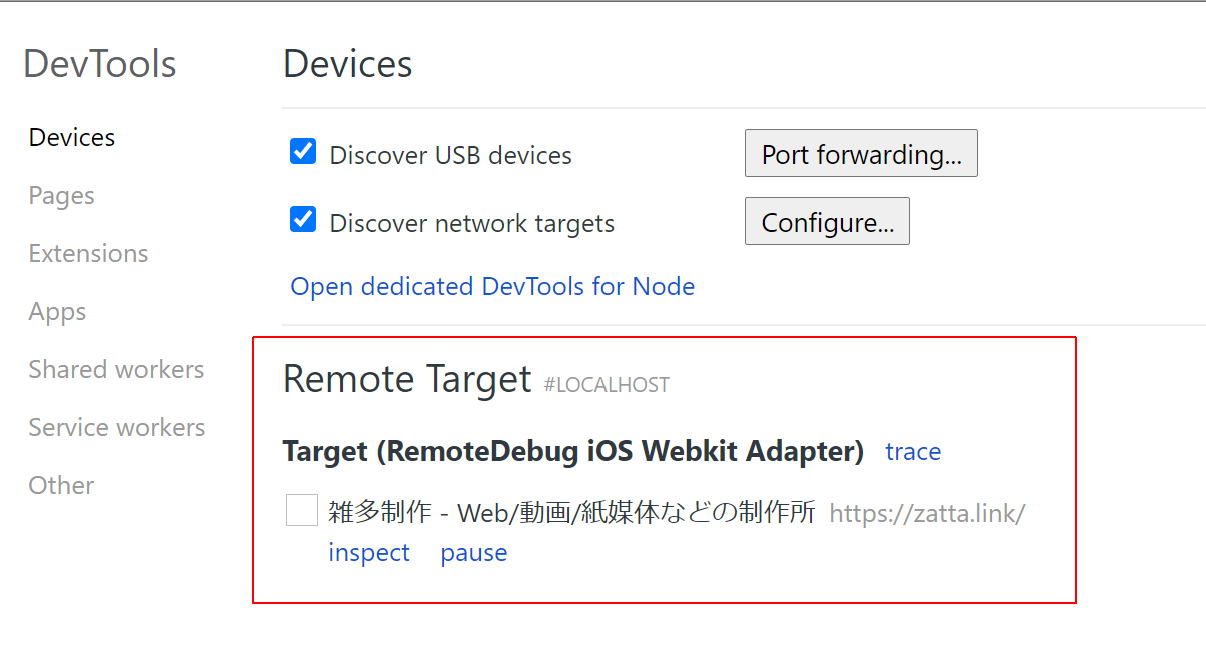
Then, the page you are browsing will be displayed in the Remote Target section of the Developer Tools page opened in your PC browser. Once it is displayed, click on the inspect link to open the developer tools.
You can also refer to the following image.
You can then inspect the elements in the developer tools and run JS in the console just like a normal web page.
The developer tools on the PC will be synchronized with the page and the scrolling position being viewed in Safari on the iPhone. However, the scrolling is not synchronized in real time, and the timing of the synchronization seems to depend on the start and end position of the tap, so there is a slight gap in the synchronization.
Quit the inspection
Press Ctrl + C on the terminal where you just executed remotedebug_ios_webkit_adapter to finish the synchronization process (remotedebug_ios_webkit_adapter).
That's all.
If you are facing a problem while debugging Safari on your iPhone that cannot be solved by the emulator alone, please try it out.